Two days of a barely-broken production system, and what they taught me about emergence, restraint, and the fix that almost wasn’t.
The most dangerous outages don’t crash.
They go quiet. Throughput drops, but no error page fires. No alarm hits the on-call rotation. The dashboards keep drawing graphs — they just draw flat lines. The system is “up” in every sense the monitoring understands. It’s just not doing any work.
You don’t notice for hours. Then you notice, and you look, and everything claims to be healthy, and there’s a moment when you wonder if the problem is actually you.
This is a story about one of those.
A normal Friday morning
The signal was a steady throughput number — call it ~200 work units per second under normal load — that had collapsed overnight to zero.
Not “near zero,” not “degraded.” Zero.
Then, about two hours later, a burst: 250/s for roughly an hour. Then silence again, six hours of it. Then another burst. Then silence.
The system wasn’t broken. It was breathing. Once every six hours.
If you’ve spent any time in distributed systems, you know the feeling that comes next — the slow, cold realization that the failure mode you’re staring at isn’t a failure at all. It’s the system doing exactly what it was told to do, but at a scale where what it was told doesn’t work anymore.
The shape of the problem
About 50,000 entities feed the work loop. Each one has a “next due” timestamp. The scheduler picks whichever ones are due, processes them, and then reschedules them based on their type and priority. Boring stuff. The kind of thing you write in a weekend and assume you won’t need to revisit.
When I built this three months ago, I picked a parameter that controls how much randomness gets added to those re-scheduling timestamps. The parameter is called spread; its purpose is to keep entities from all coming due at the same instant. I sized it deliberately for the load I expected at launch — generous enough that the re-scheduling looked uniform, tight enough that the budget per cycle stayed reasonable.
What I didn’t size it for was the load three months later, after a 5x growth curve I should have anticipated and didn’t.
At a small scale, the parameter was generous. With ten thousand entities, the spread was wide enough to be effectively uniform.
At fifty thousand, it wasn’t.
What happens when the spread is too narrow for the load? The same thing happens when buses run on a route too short for their headway. They bunch. One bus picks up a few extra passengers, falls slightly behind, picks up more passengers because more have accumulated, and falls further behind. The bus behind it catches up, picks up almost no one, and races ahead. Within a few cycles, you have two buses running together — one full, one empty — and a long, quiet stretch where neither was.
That’s what fifty thousand entities had done to themselves over a few weeks. They’d drifted into a tight cluster. Every time the system processed them, they all became “due” again at roughly the same moment. Twelve hours later: another cluster. Six hours of silence between clusters.
The technical name for this is cohort synchronization. The intuitive name is herd.
The metric that mattered wasn’t on any dashboard
The way I figured this out is worth a paragraph of its own.
The dashboards I’d built showed throughput, error rate, queue depth, and latency — all the things you’d expect. Every one of them was either “healthy” or “consistent with the throughput collapse,” which is to say, not diagnostic. Throughput was zero. Queue depth was zero. Latency was undefined. The error rate was zero. None of those numbers told me why.
The diagnostic metric was a counter — entities removed from the active pool — that I’d never charted, because under steady-state operation it was always zero or near-zero. I queried it because I’d run out of dashboard widgets to look at. It had spiked: tens of thousands of entities removed in a single sweep, then thousands more in the next.
That single line of telemetry was the entire incident.
The lesson is one I’ve now relearned three or four times in my career, and it never sticks until I see it again: dashboards reflect the failures you expected. The metrics that actually diagnose unprecedented incidents are almost always the ones no one charted. You find them by querying everything, not by looking at the wall.
After the incident, the first thing I did was promote that counter to the dashboard. The second thing I did was add four others I’d noticed during the diagnosis but had similarly never bothered to chart. The third thing I did was accept that I will probably do this again next quarter, because incidents teach you about the metrics you should have had, and there is no shortcut to knowing which ones those are.
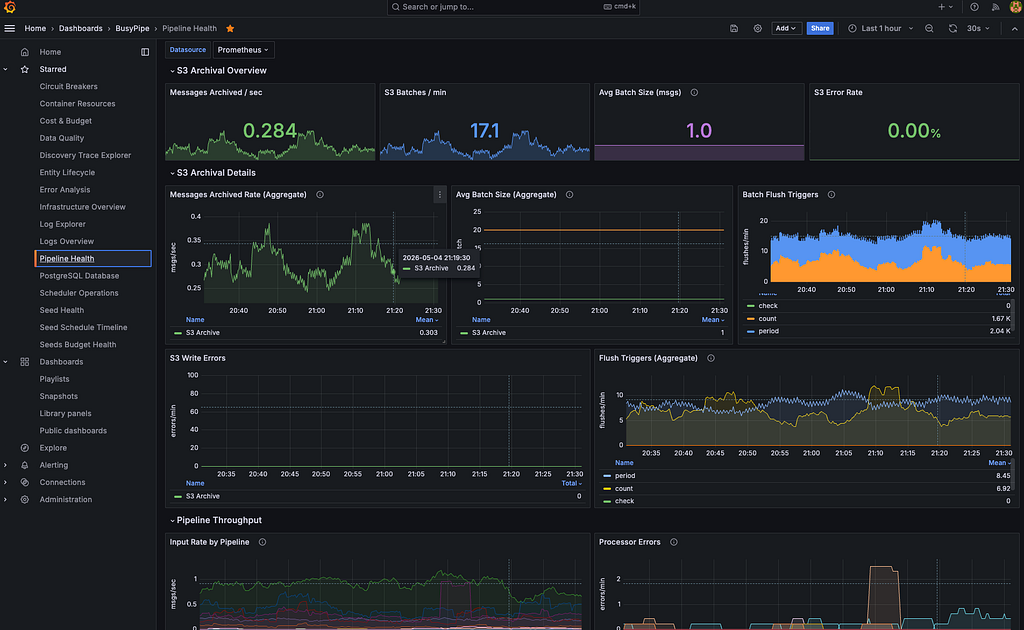 metrics from busypipe.com
The temptation to rewrite
I want to spend a moment on this, because it’s the part most postmortems leave out.
Spend a day diagnosing a herding bug in your own scheduler, and your hands start to itch. There are mature, off-the-shelf workflow systems. They give you durability, retries, observability, queue management, all the boring infrastructure you keep half-implementing. What if we just used one of those? It’s a real and persistent thought, especially around hour eighteen.
I sketched it out. Honestly. A day-long detour into “what if we migrated.”
The conclusion was the one I should have started with: the herding wasn’t a bug in the scheduler. It was a property of the workload. Migrating to anything off-the-shelf would have been a four-to-six-month project that didn’t address the actual cause. The actual cause was a number — a configuration parameter — that had been quietly too small ever since I’d crossed some threshold of scale, somewhere in the last few weeks. The actual fix was changing that number.
I changed two numbers in two pull requests. Each PR was three new tests and a one-line config change. The tests pin the new behaviour so that the parameter cannot drift back. The PRs were merged the same day they were written.
The lesson: incidents make you want to rewrite. The right answer is almost always to fix the smallest thing that resolves it, pin a test that prevents regression, and write the runbook so the next person doesn’t lose two days. The rewrite belongs on a roadmap, with a budget, after the fire is out — not in the same week as the fire.
Recovery has an order of operations
The textbook story ends when you ship the fix. Real recovery has more steps, and the steps don’t commute.
In my case, three pull requests had to land. One enforced a hard limit on the active pool. One widened the spread for the bulk of the workload. One widened it further for a particular tier of slow-cycling work. Anyone reading the diff after the fact would assume the order didn’t matter much. It did.
If you merged the limit-enforcer first, while the cohort was still bunched, you’d archive thousands of entities from inside the cluster. The ones you kept would all share roughly the same recent timestamp. The herd would reform tighter, not looser.
So the order was: spread first, then run a one-shot SQL operation that broke up the existing cluster, then the limit-enforcer on a now-evenly-distributed pool, then the second spread bump.
I wrote the order into the runbook before I ran the steps, so future-me — possibly sleep-deprived, possibly mid-incident — would not have to derive it under pressure.
Real recovery is a sequence with a footnote at every step. The fix isn’t the diff; the fix is the diff plus the order plus the reason.
The “this looks broken but isn’t” footnote
While writing the runbook, I added a warning that I’m proud of. It said, in effect: during the drain, the system will look broken. Some entities will appear overdue. Throughput will lag. Don’t roll back. Don’t panic. This is the recovery; it looks like the failure for the first four to eight hours.
The reason that the warning is in the runbook is that I almost rolled the fix back, twice, while the recovery was running. The metrics were temporarily worse in shape than they had been pre-fix — exactly the way you’d expect a queue under structural rebalancing to look — and every reflex I have was screaming to revert.
The runbook is written by people who imagine themselves anxious. A runbook that only tells you what to do but not what it’ll look like is a runbook that gets ignored at exactly the moment it was meant to be useful.
I now write a “what to expect, including the scary parts” section in every runbook I touch.
What I’d want a peer to take from this
If you’ve read this far, you’ve probably had a Friday like mine. A few things I want to keep, written down so I have a chance of remembering them:
The most expensive incidents are the quietest ones. The system that crashes pages everyone instantly. The system that goes silent gives you two days of a sinking feeling and then a long diagnosis. Build alerts on zeroes, not just on errors. A throughput of zero is an event.
The metric that diagnoses a novel incident is the one that no one charted. Query the long tail of your telemetry first. Promote whatever you find afterwards.
Resist the rewrite. Fix the parameter. Pin the test. Then put the rewrite on a roadmap with a budget and a quarter, not on a Monday with a coffee.
The order of operations during recovery is part of the fix. Write it down before you run it.
Real runbooks describe what the recovery looks like, not just what it does. Including the parts that look like the original problem.
Time-to-understand is usually much longer than time-to-fix. Once I understood, the code change was about ninety minutes of work. Understanding took two full days. That ratio is normal, and it’s easy to plan for the ninety minutes and forget the two days. That’s why the same incident keeps recurring in the same codebase under the same engineer.
Two quiet days of production cost very little in user-visible terms. The system continued to “run.” The graphs continued to draw. Some work happened in bursts.
The cost of not understanding what I’d just lived through would have been a third quiet outage a few weeks later — when neither I nor the runbook would be ready, and I’d start the diagnosis from zero again.
The system has recovered. The numbers are bumped. The tests are pinned. The runbook is on disk.
Next time it goes quiet, I’ll know how to listen.
Comments